Source: High school physics (Chinese)
Problem Sets:
Problem
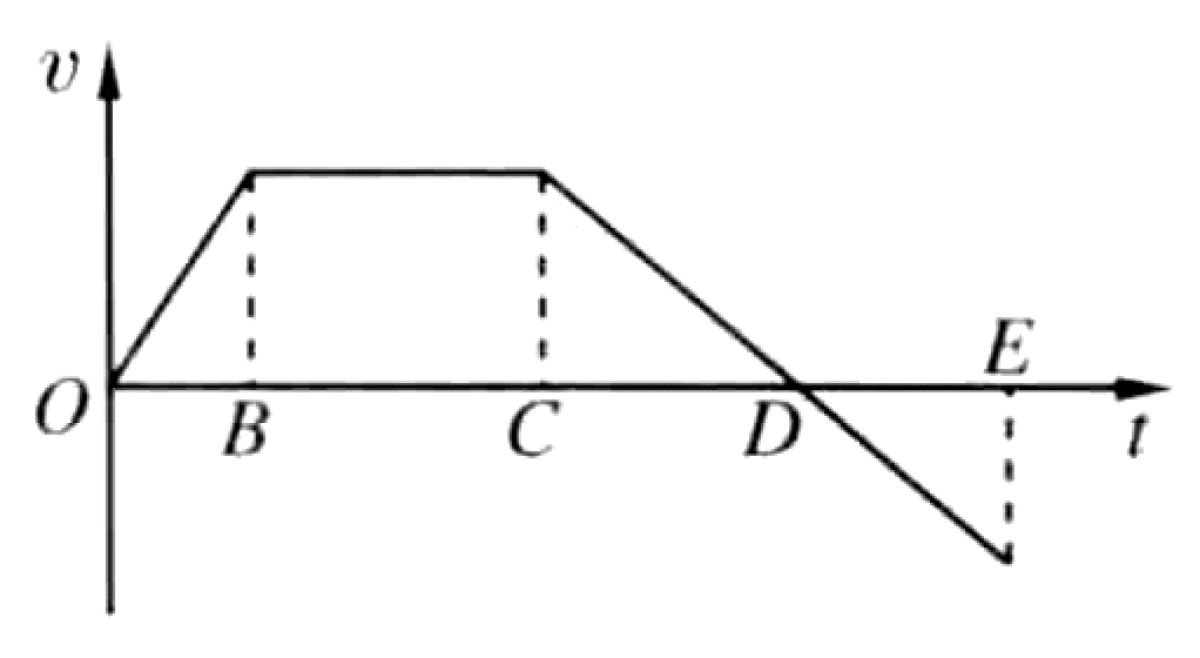
Under the action of a single variable force, an object undergoes linear motion. Its velocity-time graph is shown in the figure.
P0450-problem-1
OB: Positive (+) BC: Zero (0) CD: Negative (-) DE: Positive (+)
According to the work-energy theorem, the net work done on an object equals its change in kinetic energy: $W_{net} = \Delta E_k = \frac{1}{2}m(v_f^2 - v_i^2)$. Since a single force acts on the object, it is the net force. The sign of the work depends on whether the speed increases, decreases, or remains constant.
Interval OB: The velocity increases from $v_O=0$ to $v_B>0$. The speed increases, so $\Delta E_k > 0$. The work done is positive. Interval BC: The velocity is constant ($v_C = v_B$). The speed does not change, so $\Delta E_k = 0$. The work done is zero. Interval CD: The velocity decreases from $v_C>0$ to $v_D=0$. The speed decreases, so $\Delta E_k < 0$. The work done is negative. Interval DE: The velocity changes from $v_D=0$ to a negative value $v_E$. The speed increases from 0 to $|v_E|$, so $\Delta E_k > 0$. The work done is positive.